If you have a server, you know it is useful to have information of your server to troubleshoot and detect problems or bad configurations, usage of the CPU, ram, network and health of the HDD.
There are plenty of options: monit, monitorix, munin, Netdata and Grafana (coupled with one data collector like: collectd, influxdb, Graphite or Prometheus)
Despite Grafana is one of the most popular choices, I decided to use Netdata, since it is pre-configured out of the box and it does both collect data and create graphs displayed through a http server. It is lightweight that will only require 1% CPU usage and around 12 MiB of RAM (at least in my OpenWrt router). Munin is my second choice, but decided to go with Netdata just because it just worked fine after install without too much hassle to configure.
Netdata is a real-time performance and health monitoring tool. It can run on all your physical/virtual servers, containers, cloud deployments, and edge/IoT devices. Out of the box it generates lots of graphs in a default dashboard and you can create your own dashboard to show the specific graphs you are more interested to.
Installing Netdata
Netdata is like a single binary, so just install it like:
Archlinux:
| |
OpenWrt:
| |
And finally start the daemon Archlinux:
| |
OpenWrt:
| |
Configure
There is not much to configure, really. You can access http://localhost:19999/ (where localhost can be substituted by the ip of your server) and will take you to the default dashboard.
For OpenWrt config file is already optimized for low resources devices.
What you might want to do is create a custom dashboard that fits the most important metrics you want to follow quickly.
Custom Dashboard
Simple dashboards are written in HTML, so you might need basic knowledge of html. More complicated dashboards can be written in javascript, but in my case html is just fine.
First look at the template here (you can also see all the supported graphs) and here (view the page source at the latter). You can see the blocks contained between the <div "content" ></div>. This will be used to add graphs to the dashboard, and the "content" will include variables like the unique id, width, height, type of graph.
Be sure to put these <div> blocks inside the <body> </body> of the html file. Also replace your server ip in the <script type="text/javascript" src="http://netdata.server:19999/dashboard.js"></script> section
Identify the IDs
Unique IDs reffer to the part of the system or metric being monitored. It could be system.cpu (for CPU usage), system.ram (ram usage), net.eth1 (bandwith monitor on interface eth1), disk.sda (Disk I/O Bandwidth in sda disk), etc.
You can check the full existing IDs being monitored in http://your.server.ip:19999/api/v1/charts and expand the charts section. The ID is declared as:
| |
Type of graph
The default chart library is dygraph, but you can set a different chart library per chart using data-chart-library. The graphs can be dygraph, d3, d3pie, gauge, google, easypiechart, peity, sparkline and text-only. The documentation is not very clear on how to use each graph, but mostly dygraph, easypiechart, d3pie and gauge will give you most the graphical input needed. The type of graph is declared as:
| |
Other attributes
You can specify other attributes such as tittle, colors, height and width to prettify the dashboard.
- Title: Will override default tittle text
data-title="my super chart" - Colors: By default, netdata uses an internal palette of colors for the dimensions of the charts. You can prepend colors to it (so that your will be used first) using this
data-colors="#AABBCC #DDEEFF ..." - Height and with: You can specify a custom height and width and it can be anything CSS accepts for width and height (e.g. percentages, pixels, etc)
data-width="WIDTH"anddata-height="HEIGHT" - Data points: For the time-frame requested, netdata will use the chart dimensions and the settings of the chart library to find out how many data points it can show. A default dygraph will show 10 min of data (600 s), you can set the data point to 300 in order to update the graph every 2 s
data-points="300" - Data dimensions: By default, a netdata graph will show all the dimensions of the chart. You can select specific dimensions using this
data-dimensions="dimension1,dimension2,dimension3,..."You can check all the dimensions by expanding the ID in thechartsection inhttp://your.server.ip:19999/api/v1/charts. For example,net.eth1dimensions arereceivedandsent. This attribute is useful for graphs like pie or gauge to display an specific dimension of a metric.
In summary, you could have a dygraph and gauge like this:
| |
Final thoughts
- Netdata is simple to install and use, since it is pre-configured.
- If you need a more robust tool, you might take a look at the Grafana and influxdb.
- You can enable more plugins such as netdata S.M.A.R.T. attributes plugin to monitor HDD/SDD health.
- As a health monitor, Netdata comes with some configured alarms that will trigger warnings in the default dashboard but you can also set email notifications and even telegram notifications.
- Finally, here are some examples of my own custom dashboard (below screenshots using my phone), one is used for my media server and the other on my OpenWrt router.
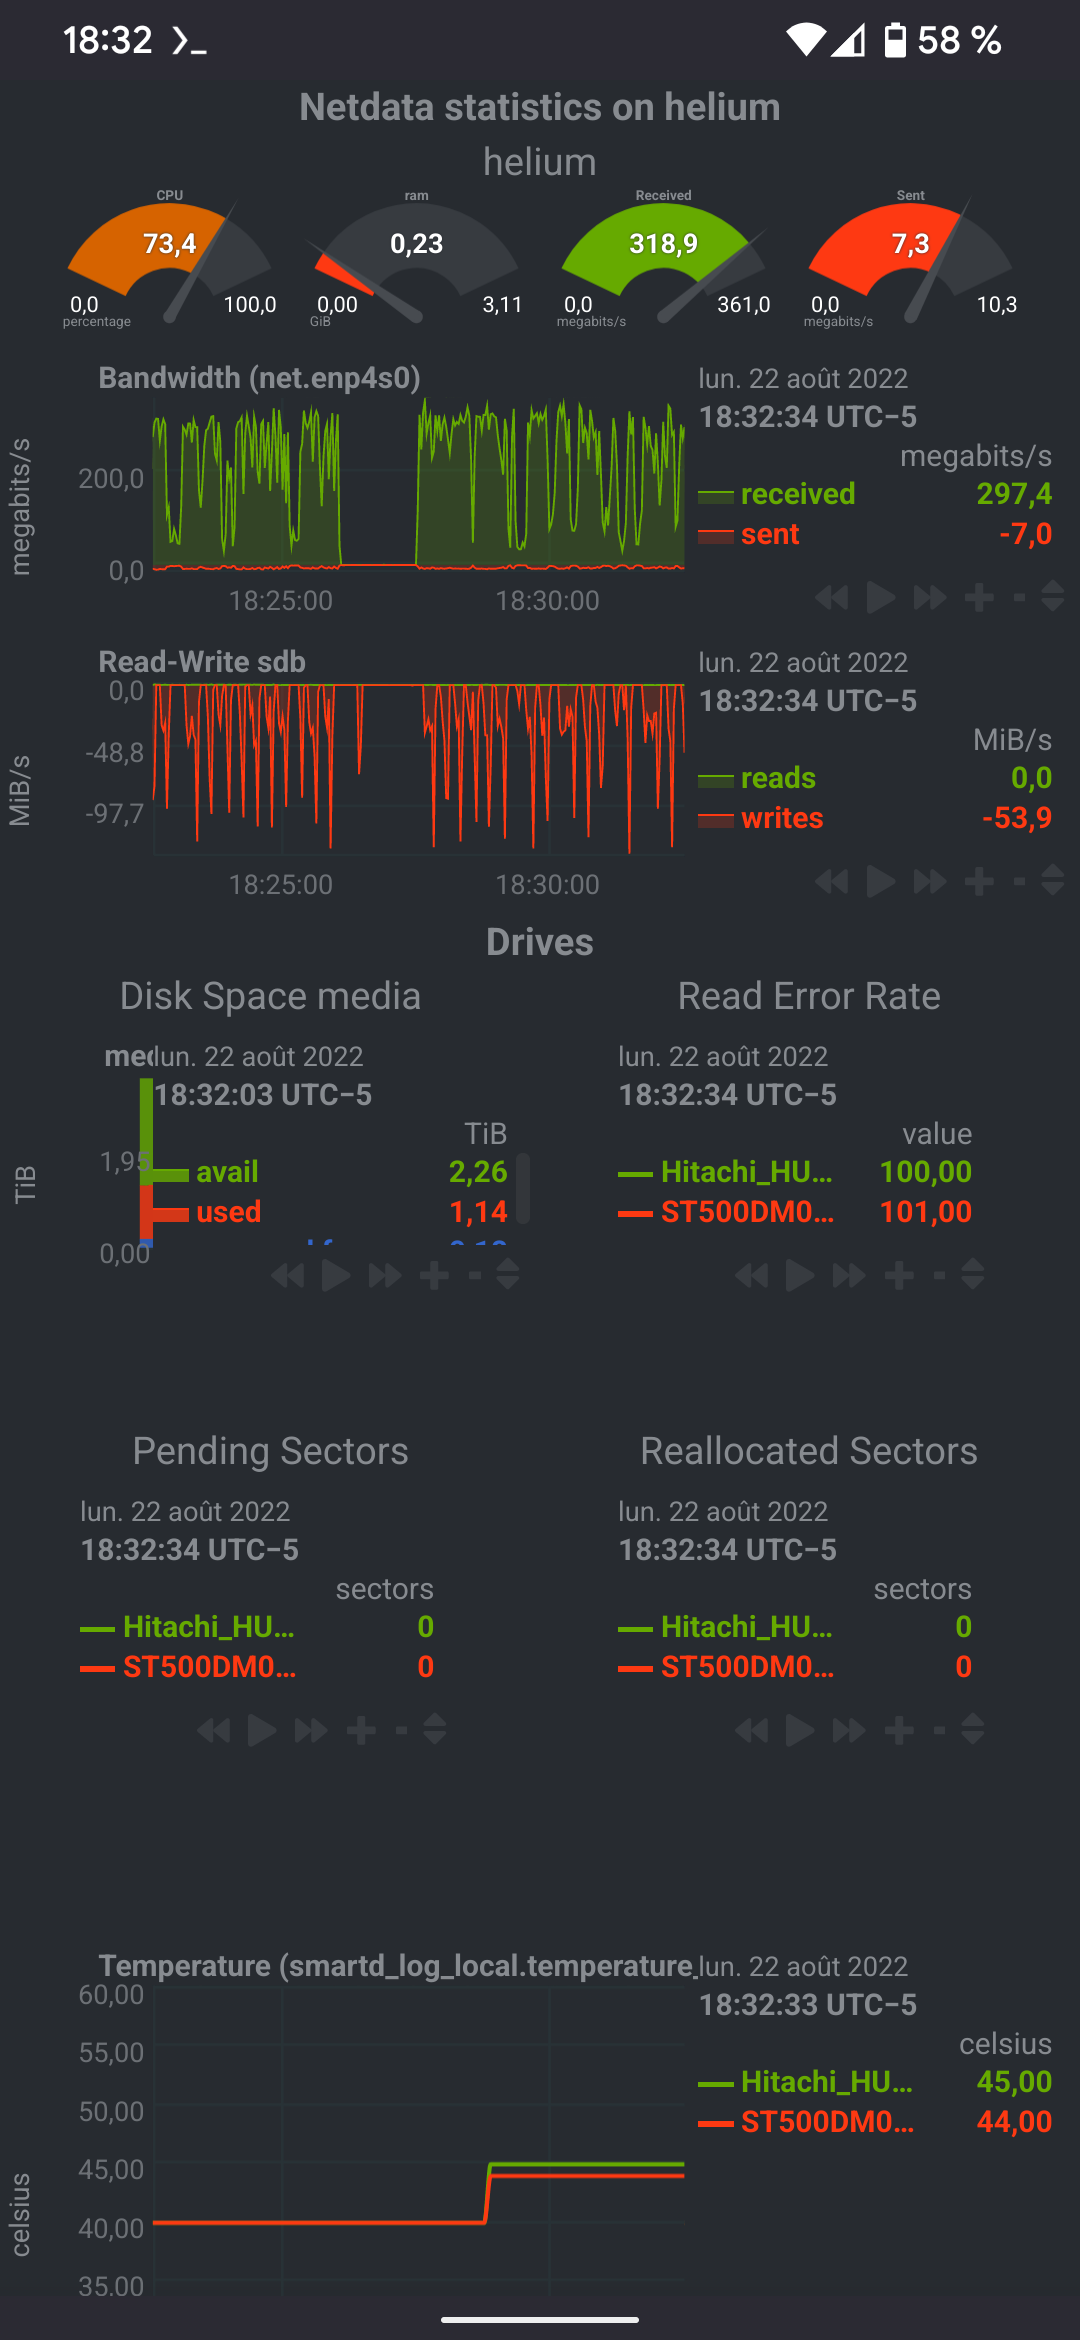 | 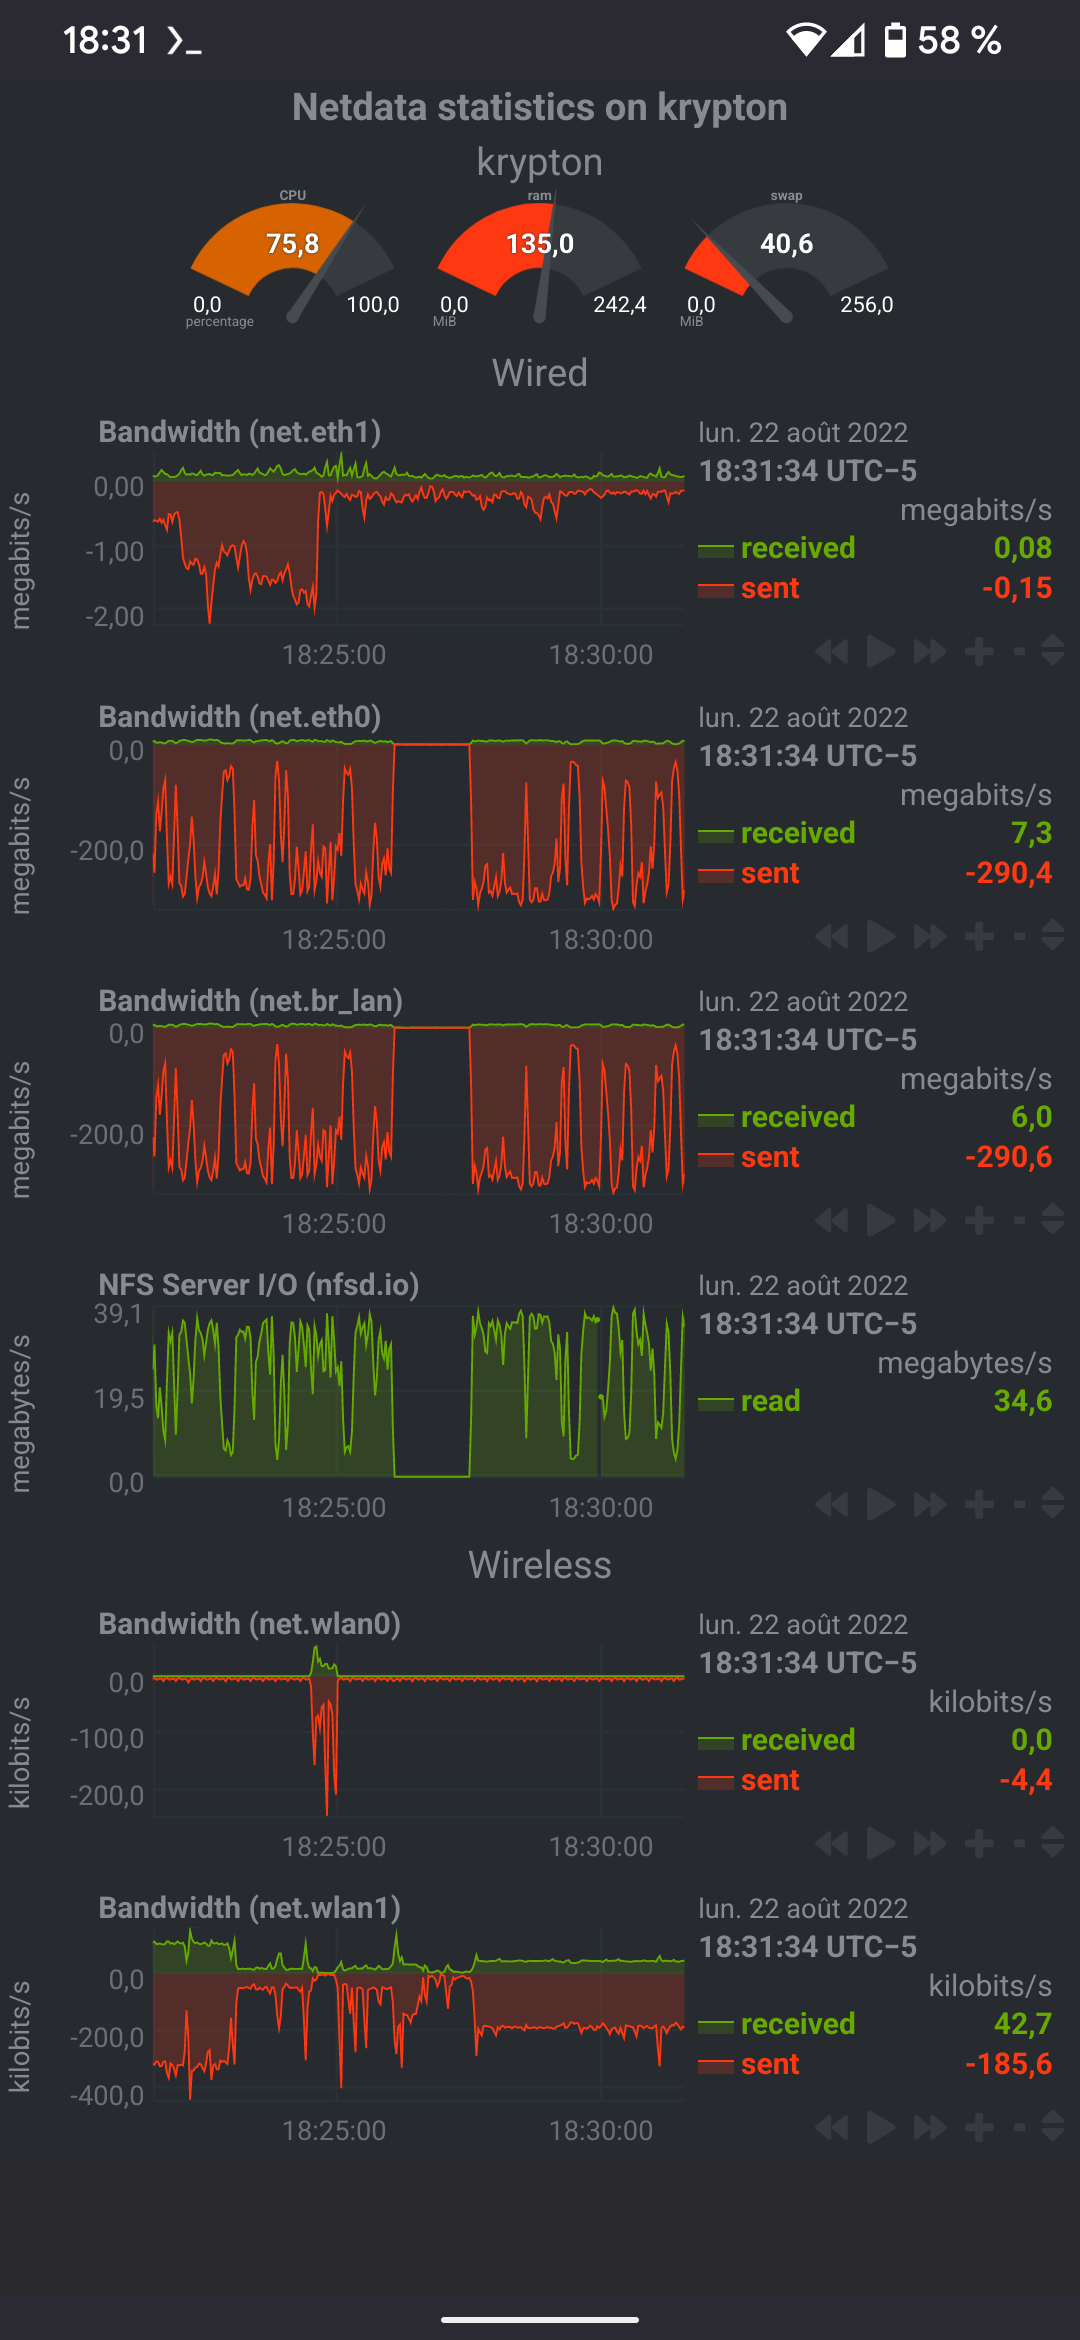 |
If you found this content useful, please support me:
BTC: 1E2YjL6ysiPxRF4AEdXChpzpesRuyzgE1y